")
Here’s what business owners need to know about financial dashboards for their businesses. For most business owners, their company’s financial health is at the top of their priority list, or at least it should be.
But then life gets in the way, and they find themselves swamped with work and unable to track their budget or how things are going financially. Frustration can come when there are a bunch of moving pieces, and a steep learning curve to figure out what KPIs to track, and how to do it. Many business owners we speak to wish they could just run the day-to-day and have something else following the rest. This is where an excellent financial tracking tool comes in handy – but where do you start?
What is a financial dashboard?
A dashboard is an online tool that consolidates a company’s financial data into one convenient place. Some companies want to look at their ability to meet goals. And some savvy owners also focus on balance sheet metrics such as bank accounts, credit card debt, inventory levels, accounts receivable, and more. There’s a wide range of what a financial dashboard makes visual.
An excellent financial dashboard provides a clear overview of the company’s financial situation. It also helps spot trends and potential problems before they become too big to handle. For example, rising sales, higher sales goals, and a dip in inventory might signal the need to restock before it becomes a significant issue. Increasing sales and a drop or flat profitability might indicate the opportunity to raise prices.
Click here to connect and ask us a question!
Take a look at what our consultants at Strategy Leaders can do to help you make things visible for yourself, your company, and your management team. Available in both desktop versions and as an app for quick access on the go, it’s a tool that’s always at your fingertips with critical information that can help you make more money faster.
Our financial dashboards can be customized to meet your specific needs. For example, you can track your company’s revenue, expenses, cash flow, and profitability. You can set goals and compare how you’re doing – over time and month by month. You can also track vital ratios, such as your company’s profitability, debt-to-equity performance, and return on investment. It’s a great tool to keep you on track and on a budget.
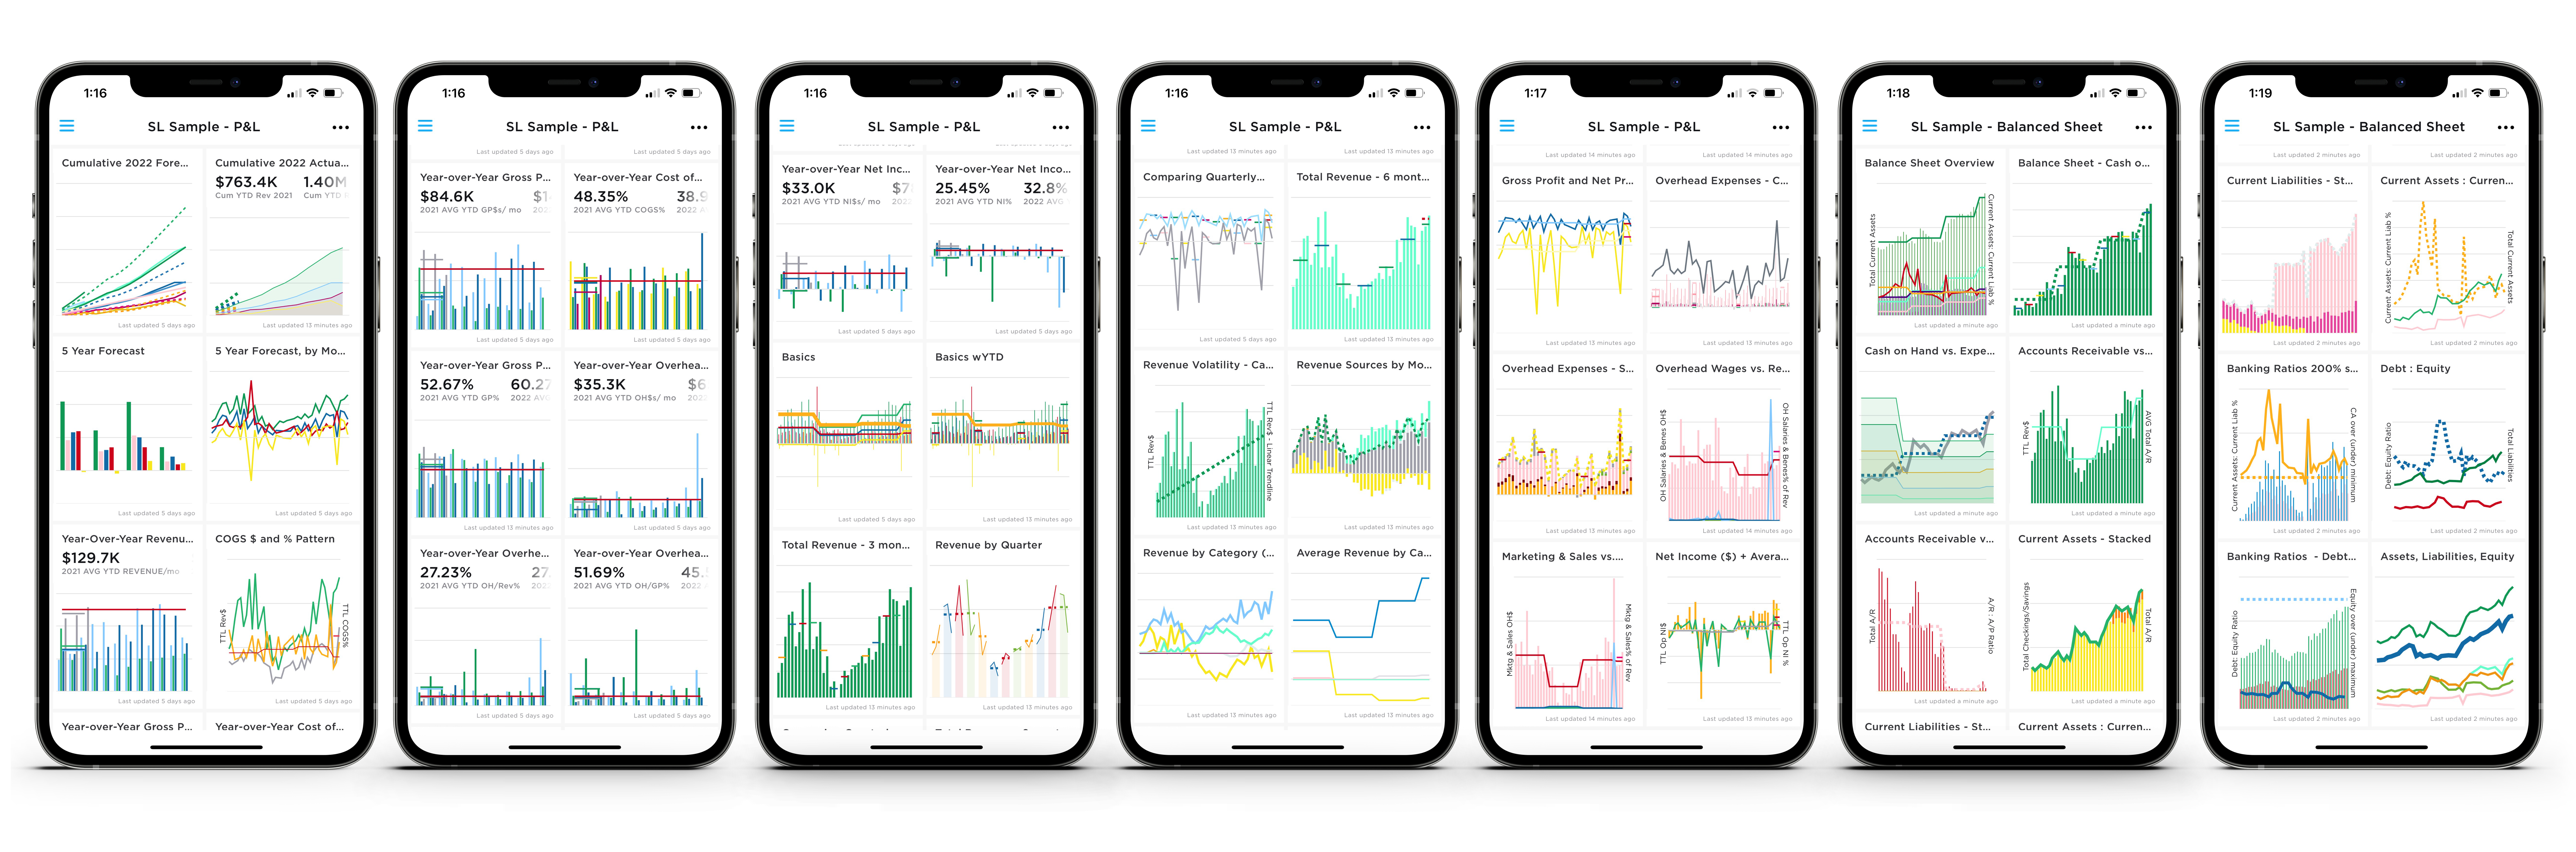
So what can you see on our dashboards? Read on to see some examples!
Cumulative 2022 actual vs. 21 and 20 actuals looks at the business as a whole from the current year to date versus the actuals from the past two years.

Easily compare this year’s financials to last year’s and the year before.
Quickly spot what is up and what is down. Make successes and problems more visible. Promptly look for trends you can use in the planning process.
Budget vs. actuals looks at what the company has projected to spend versus what is actually happening month in and out.

Got a budget? Great! Wish you had a budget? No problem. Either way, the financial dashboard will help you see how your company is doing compared to its budget, or so you can understand the trends that will help you set up a budget. Once you have a budget, you can find valuable details that will help you make adjustments and other details that will let you know when to keep things going as is.
Revenue, expenses, and profitability
Our financial dashboard can help business owners get a handle on what is going on in their business in real time. Your customized dashboard tracks your company’s revenue and expenses to see how profitable your company is.
Cash flow
Monitor your company’s cash flow to ensure there is enough cash on hand to meet your company’s financial obligations.
Understanding what is happening historically can lead to using that data to forecast. Not sure how to do that? We can help.
YOY revenue $
Track your company’s year-over-year revenue growth.
Find out what kind of growth rate your company is generating. Figure out if that is not enough. Play with options, precisely what you have to hit on an average monthly for revenue to hit your goal. The software will also allow you to adjust your plans.
COGS $ and % Patterns
Track your company’s cost of goods sold to see how it affects its bottom line.
Most companies do not handle COGS well (Cost of Goods Sold). Something we do with our clients is to help them understand what belongs to COGS and what doesn’t. It is very different from what goes into COGS for tax purposes, and knowing the difference is crucial in successfully planning how to grow the business.
YOY Gross Profit $
Track your company’s year-over-year gross profit growth.
The second component of the COGS equation is gross profit, which you have left over to run the company, put money in the bank, pay off debt, and reward shareholders. Gross profit should rise with revenue; the more revenue, the more gross profit, with the potential for an increasing dollar amount to drop straight to the bottom line and into your bank account.
YOY Overhead $
Track your company’s year-over-year overhead growth.
How much does switching your light bulb on, paying the rent, and covering fixed costs cost? If you know the answer to that question and your gross profit %, you can forecast what breakeven looks like and what growth returns to expect. Keeping constant overhead yearly can be a secret to successfully building your bottom line. Not sure how to do that? Talk to one of our consultants. They’d be happy to take your call.
YOY Overhead over revenue %
This tracks how much of your revenue is going towards overhead costs.
You want this percentage to drop as revenue rises. That tells you you’re getting increasing productivity and payoff from your investment in overhead. And that means you have more money to reinvest in the company or give yourself a raise.
Revenue by quarter
Track your company’s revenue quarterly.
Spot the ups and downs. Know where to focus your efforts on building more potential and where you can sit back and let the money roll in. What’s up or down vs. last year – and by how much.
Total revenue – 3 months averages
See your company’s total annual revenue for the past three months.
The graph also looks at revenue. Some clients prefer to see it one way, while others wish to see it another.
Consider the relative performance of the quarters. What months did you finish below or on average? It’s just one more perspective on things, a quick feel for how things are going, and a chance to start talking with management about how you’re doing and what you all need to do to put the accelerator down in a precisely straight month.
Banking Ratios, Debt Equity, Assets, Liabilities & more!

In addition to financial information, you can also track your company’s marketing performance with our marketing dashboard.
This dashboard can help track your website traffic, social media engagement, and email open rates. You can also track your marketing campaigns to see which ones perform well and need improvement.
With our financial and marketing dashboards, you can see your company’s financial health and marketing performance. These dashboards can help you make informed decisions about allocating your resources – financial and human. Contact us today to learn more about how we can help you grow your business with any of our services!
Remember, with our dashboard tools, you can:
- Track your revenue, expenses, and profit margins
- See how your marketing campaigns perform and make adjustments accordingly
- Assess how your company’s economic health trends over time
With our powerful financial dashboard, you can view all your information in one place. Get a demo today and see how easy it is to make informed decisions about resource allocation with a tap on an app or desktop version!
Need help creating a budget? Join our upcoming webinar here.